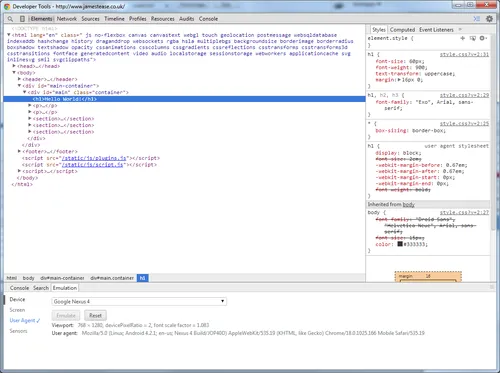
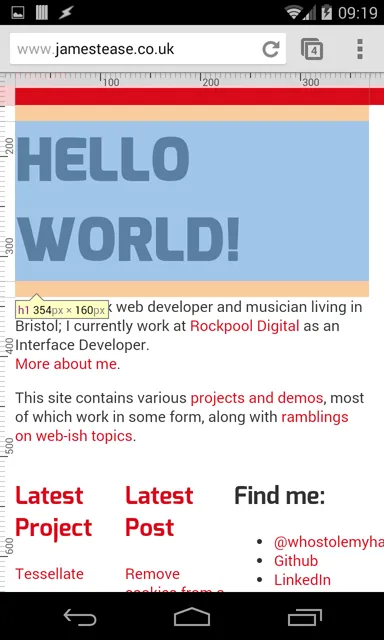
Ever need to debug a website on mobile? You can get the standard dev tools for both iOS Safari and Android Chrome to inspect any website, so you can debug layout and Javascript, see network requests and most importantly, view the console!
Android Chrome
You’ll need the latest version of Chrome on computer and phone/tablet. If you don’t have the latest version, you could try the legacy workflow. This is temperamental, and you’ll need the Android SDK set up on your machine.
- Enable dev options on the device: Settings > Developer Options > USB debugging.
- If Developer options is not visible in Settings, go to Settings > About device and tap Build Number seven times. Developer Options will then be added under Settings.
- Connect the device via USB.
- Open Chrome on your machine and go to about:inspect . This will open a page listing connected devices and the Chrome tabs on the device. Click ‘inspect’ under one of the tabs to get dev tools open and debug away!


iOS Safari
To debug Safari on iOS, you’ll need to use a Mac with Xcode installed; the Mac must be Lion or later with Safari 6 and the phone must be iOS6+.
- On the phone, go to Settings > Safari > Advanced and enable Web Inspector.
- Open Safari on the phone.
- Connect the phone to the Mac.
- On the Mac, open Safari and go to Develop > iPhone > [your tab name].
- If Develop isn't in Safari's toolbar, go to Safari > Preferences > Advanced and enable ‘Show develop menu’.